2026 winter-wheat evidence record · compiled 20 August
Britain’s wheat harvest, from field to national supply.
The national average hides the defining feature of 2026: a crop split sharply across regions, fields and parts of the same field. This record brings the map, the weekly crop history and the public harvest evidence together—without forcing unlike sources into artificial agreement.
Forecast issued 17 August 2026Yield imagery to 1 Aug · mapping to 17 AugGreat Britain winter wheatEvidence compiled 20 August 2026
Defra final · our call
7.18 t/ha
90% interval · 7.01–7.36 · ordinary-year
Our forecast of the official UK all-wheat figure — the number to set against Defra statistics when they publish. How it is derived.
Winter-wheat yield · Great Britain
7.70 t/ha
90% interval · 7.13–8.28
What we measure: a model estimate for the mapped winter-wheat fields, standardised moisture — not a combine record.
Mapped area
1.558 Mha
±16,000 ha · 90% interval
200,161 field geometries classified as winter wheat.
Production
12.00 Mt
11.10–12.90 Mt · 90% interval
Area multiplied by field-level yield, then aggregated.
Crop · winter wheatGeography · Great BritainYield imagery · to 1 AugMap imagery · to 17 AugOutput · field → region → nationalStatus · model estimate
READING NOTE
Before comparing the numbers
Each source sees a different part of the harvest.
A satellite field estimate, a farm survey, a crop-condition score, a variety trial and a national balance sheet are all useful. They are not interchangeable measurements of one thing.
“The aim is not to decide which number wins. It is to show what each instrument observed, where the evidence aligns, where it pulls apart and what the final statistics will test.”
Our field recordGreat Britain winter wheat inferred field by field from satellite observations — yield from imagery to 1 August, field mapping updated to 17 August.
AHDB harvest surveyWheat yields reported by participating farms from the crop harvested so far, using AHDB’s published nationalisation and moisture procedure.
AHDB crop developmentThe share of winter-wheat area assessed in five condition classes. It describes condition, not tonnes per hectare.
Recommended ListsManaged variety-trial performance relative to controls. The sites are not designed to represent commercial national yield.
USDA and DefraUnited Kingdom all-wheat production or final official area, yield and production—broader targets than Great Britain winter wheat.
01 / SPACE
The harvest split before it averaged
The first result is the geography—not 7.70.
Spring rainfall divided England. The field map, produced without weather as an input, shows the same broad north–south pattern. That agreement is a useful external consistency check, not proof that rainfall alone caused the yield pattern.
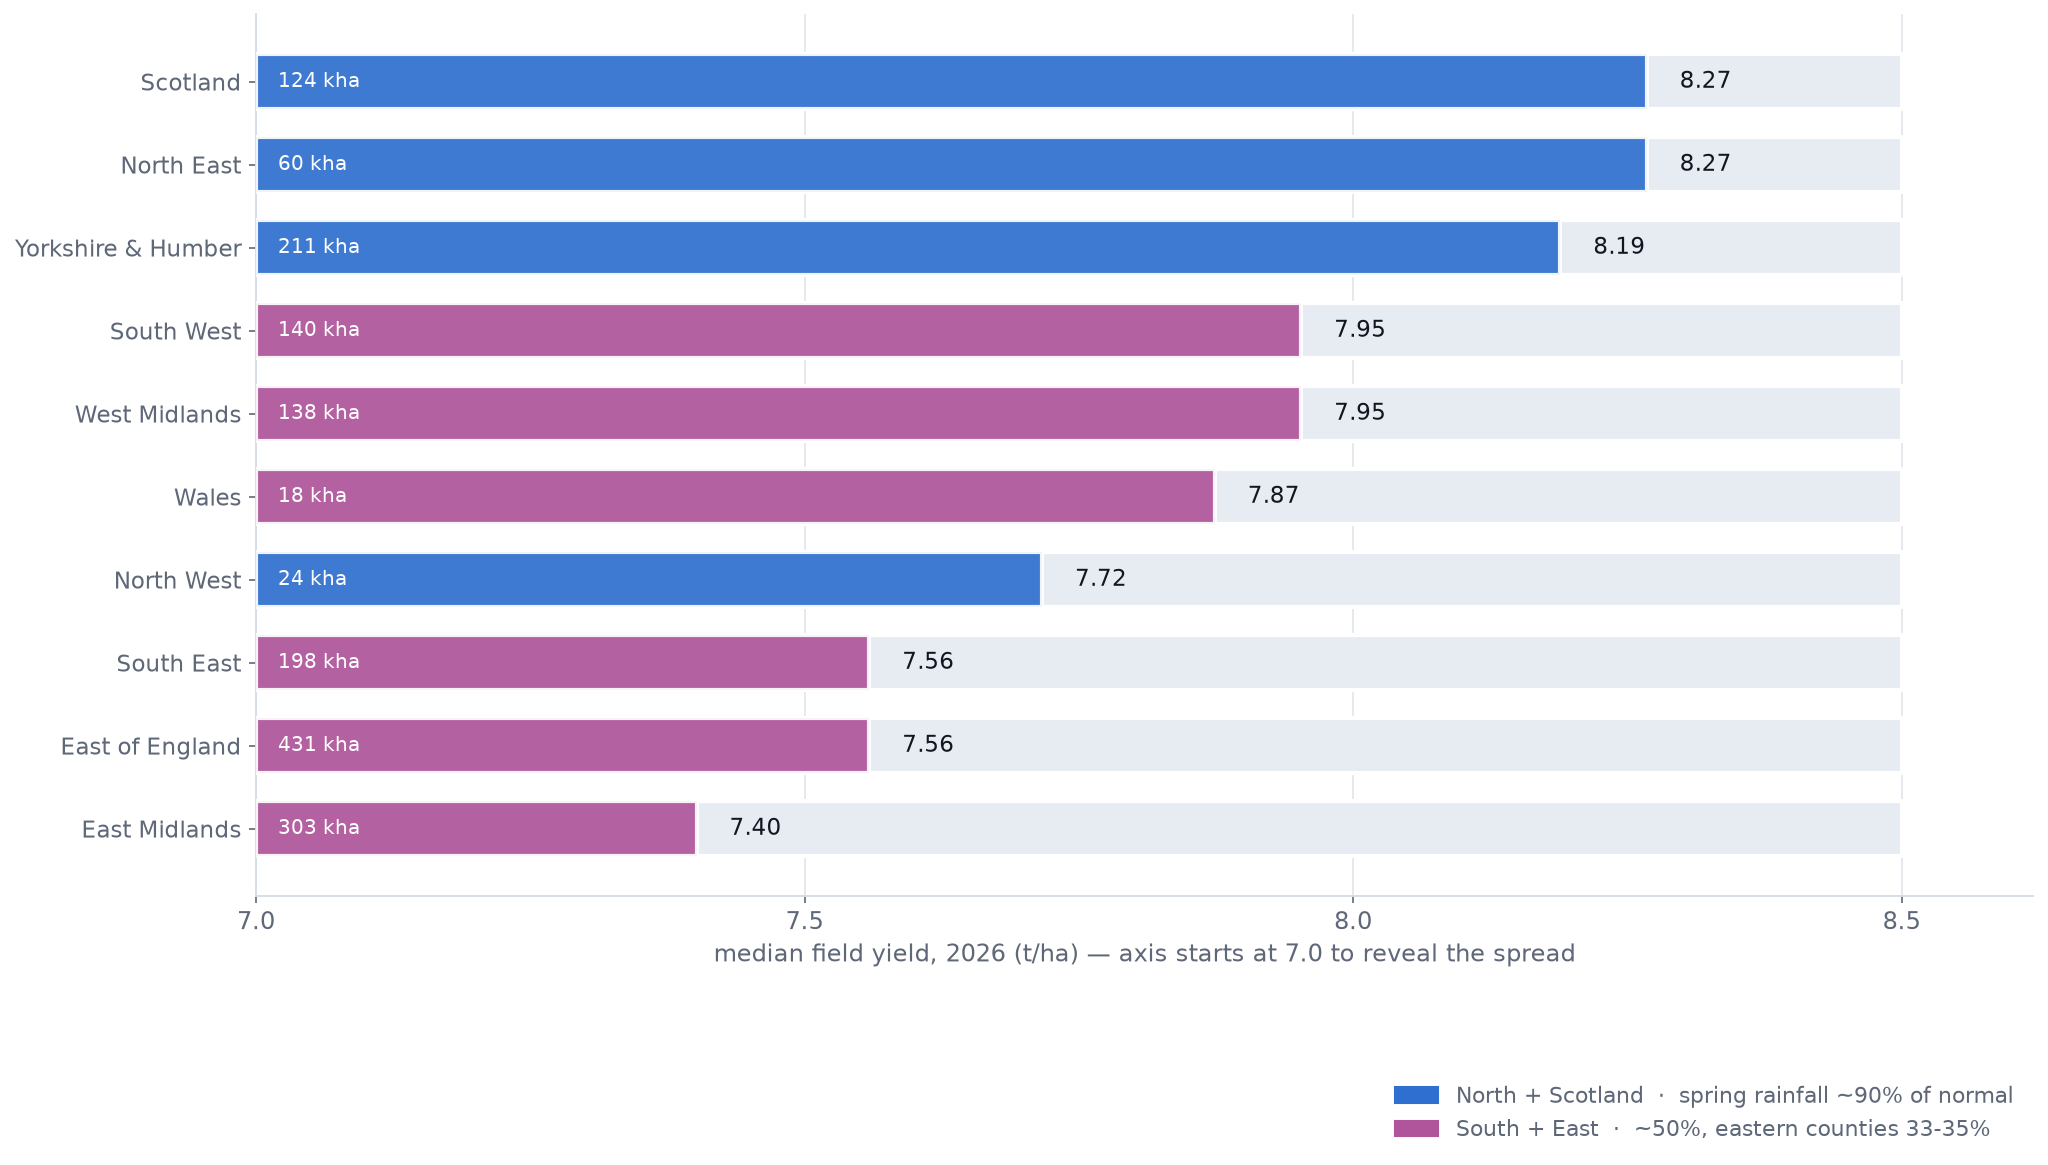
Regional median field yield
The strongest medians sit farther north.
Model estimate
North East
8.27
Scotland
8.27
Yorkshire & Humber
8.19
East of England
7.56
South East
7.56
East Midlands
7.40
7.07.58.08.5 t/ha
Bars are scaled from 7.0 to 8.5 t/ha to reveal the regional spread. The full measured record — every region, with its mapped area — follows below the distribution.
Area distribution
A national mean made from two visible tails.
1.558 Mha mapped
7.9%
86.0%
6.1%
123,000 ha below 6 t/ha
1.340 million ha between 6 and 9 t/ha
95,000 ha above 9 t/ha
Both a severe low-yield tail and a substantial high-yield tail can coexist. Field-level coverage shows where each sits and how much area it represents.
The measured record
Every region, with its mapped area.
Model estimate
Median field yield for all ten regions on a declared 7.0–8.5 t/ha scale, so the spread is visible, coloured by the published spring-rainfall split (north ~90% of normal; south ~50%, eastern counties 33–35%). Our yields use no weather input, so the agreement is a consistency check, not attribution. Tap the chart to open it full size.
02 / TIME
The season can be replayed
A forecast is more useful when its development is visible.
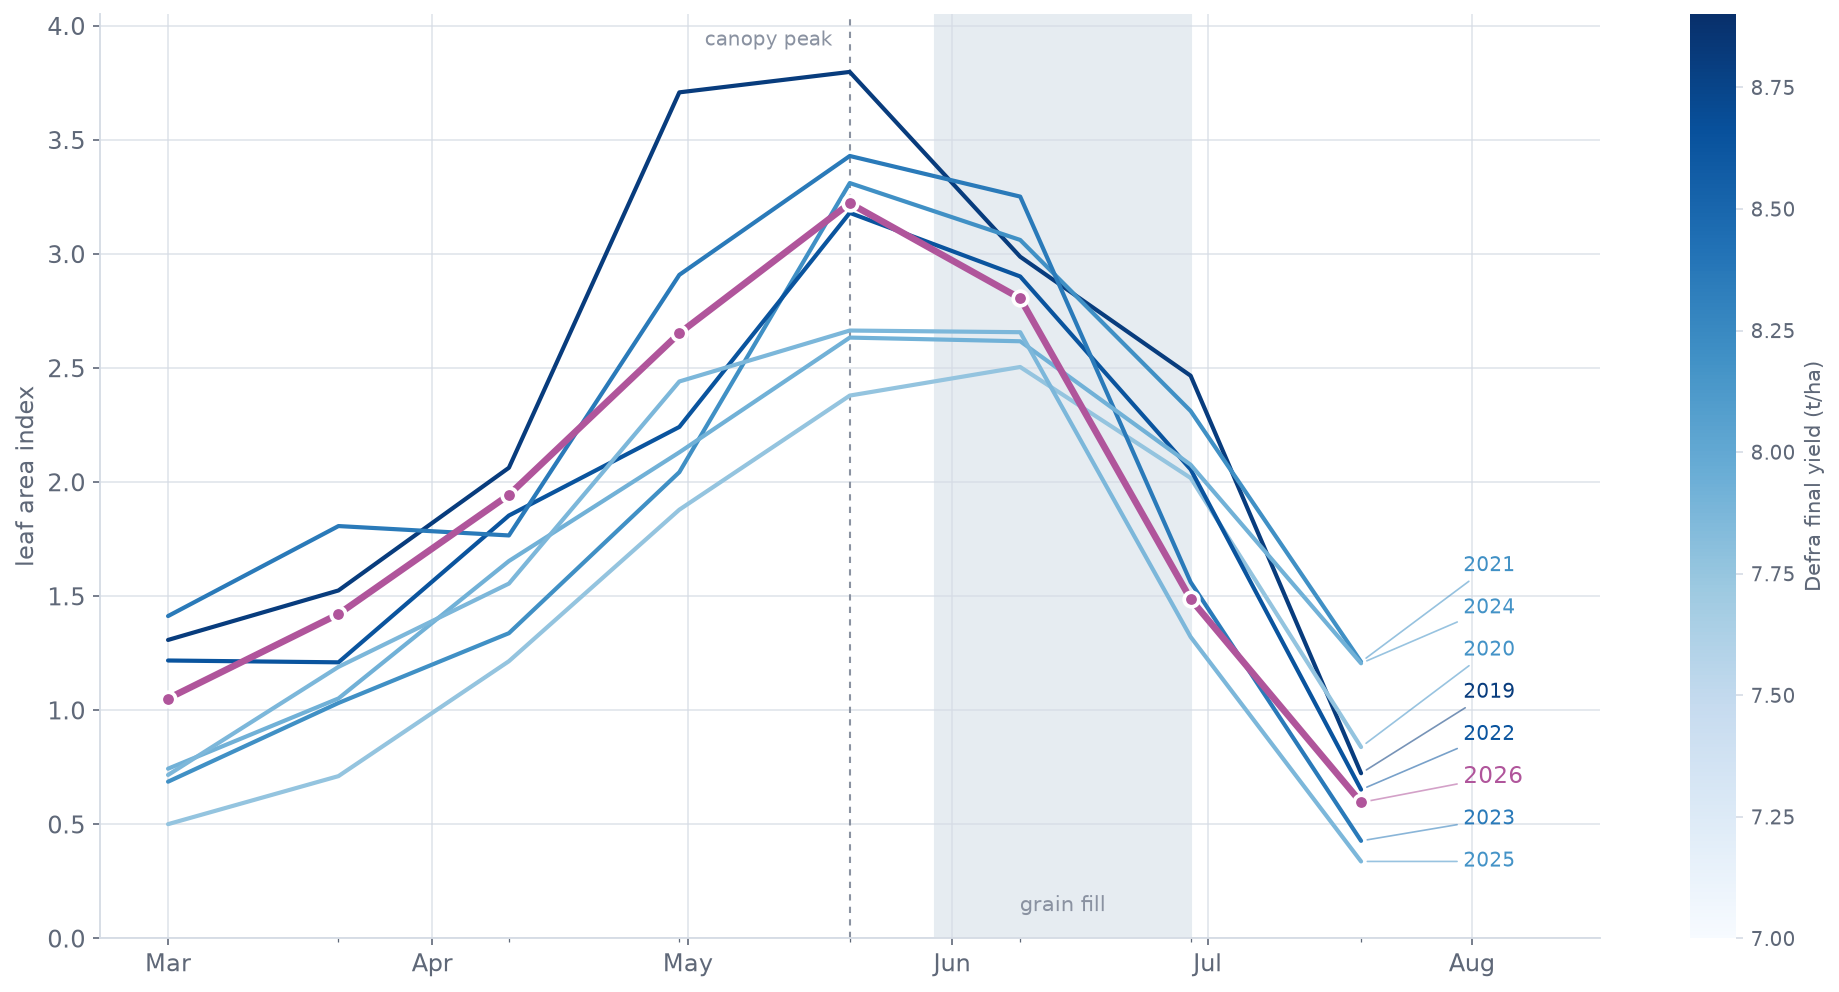
The crop reached its national canopy maximum in the third week of May, then matured rapidly. The weekly record lets a reader see when the estimate stabilised—and whether a revision came from mapped area, crop state or calibration.
Season timeline
The 2026 season on one date axis
Dates + model issues
End April
75% of winter wheat rated good or excellent
Third week of May
National canopy reaches seasonal maximum
End May
Good/excellent condition falls to 64%
22 June
58% good/excellent in final crop-development report
1 August
Yield cutoff — the estimate freezes; field mapping continues weekly
17 August
Frozen forecast issued
Each weekly issue behind this timeline is archived with its cutoff in the dated report; the canopy record it derives from is below.
Eight seasons of canopy
The season, replayed against seven predecessors.
Derived from imagery
Leaf-area trajectories for 2019–2026, shaded by each year’s final yield. 2026 peaked fourth-highest in late May, then declined steeply — the dates the timeline marks are visible in the curve itself. Darker lines are higher-yielding years; the tallest canopies are not simply the best harvests. Tap the chart to open it full size.
Simple canopy check · LAI
7.94 t/ha
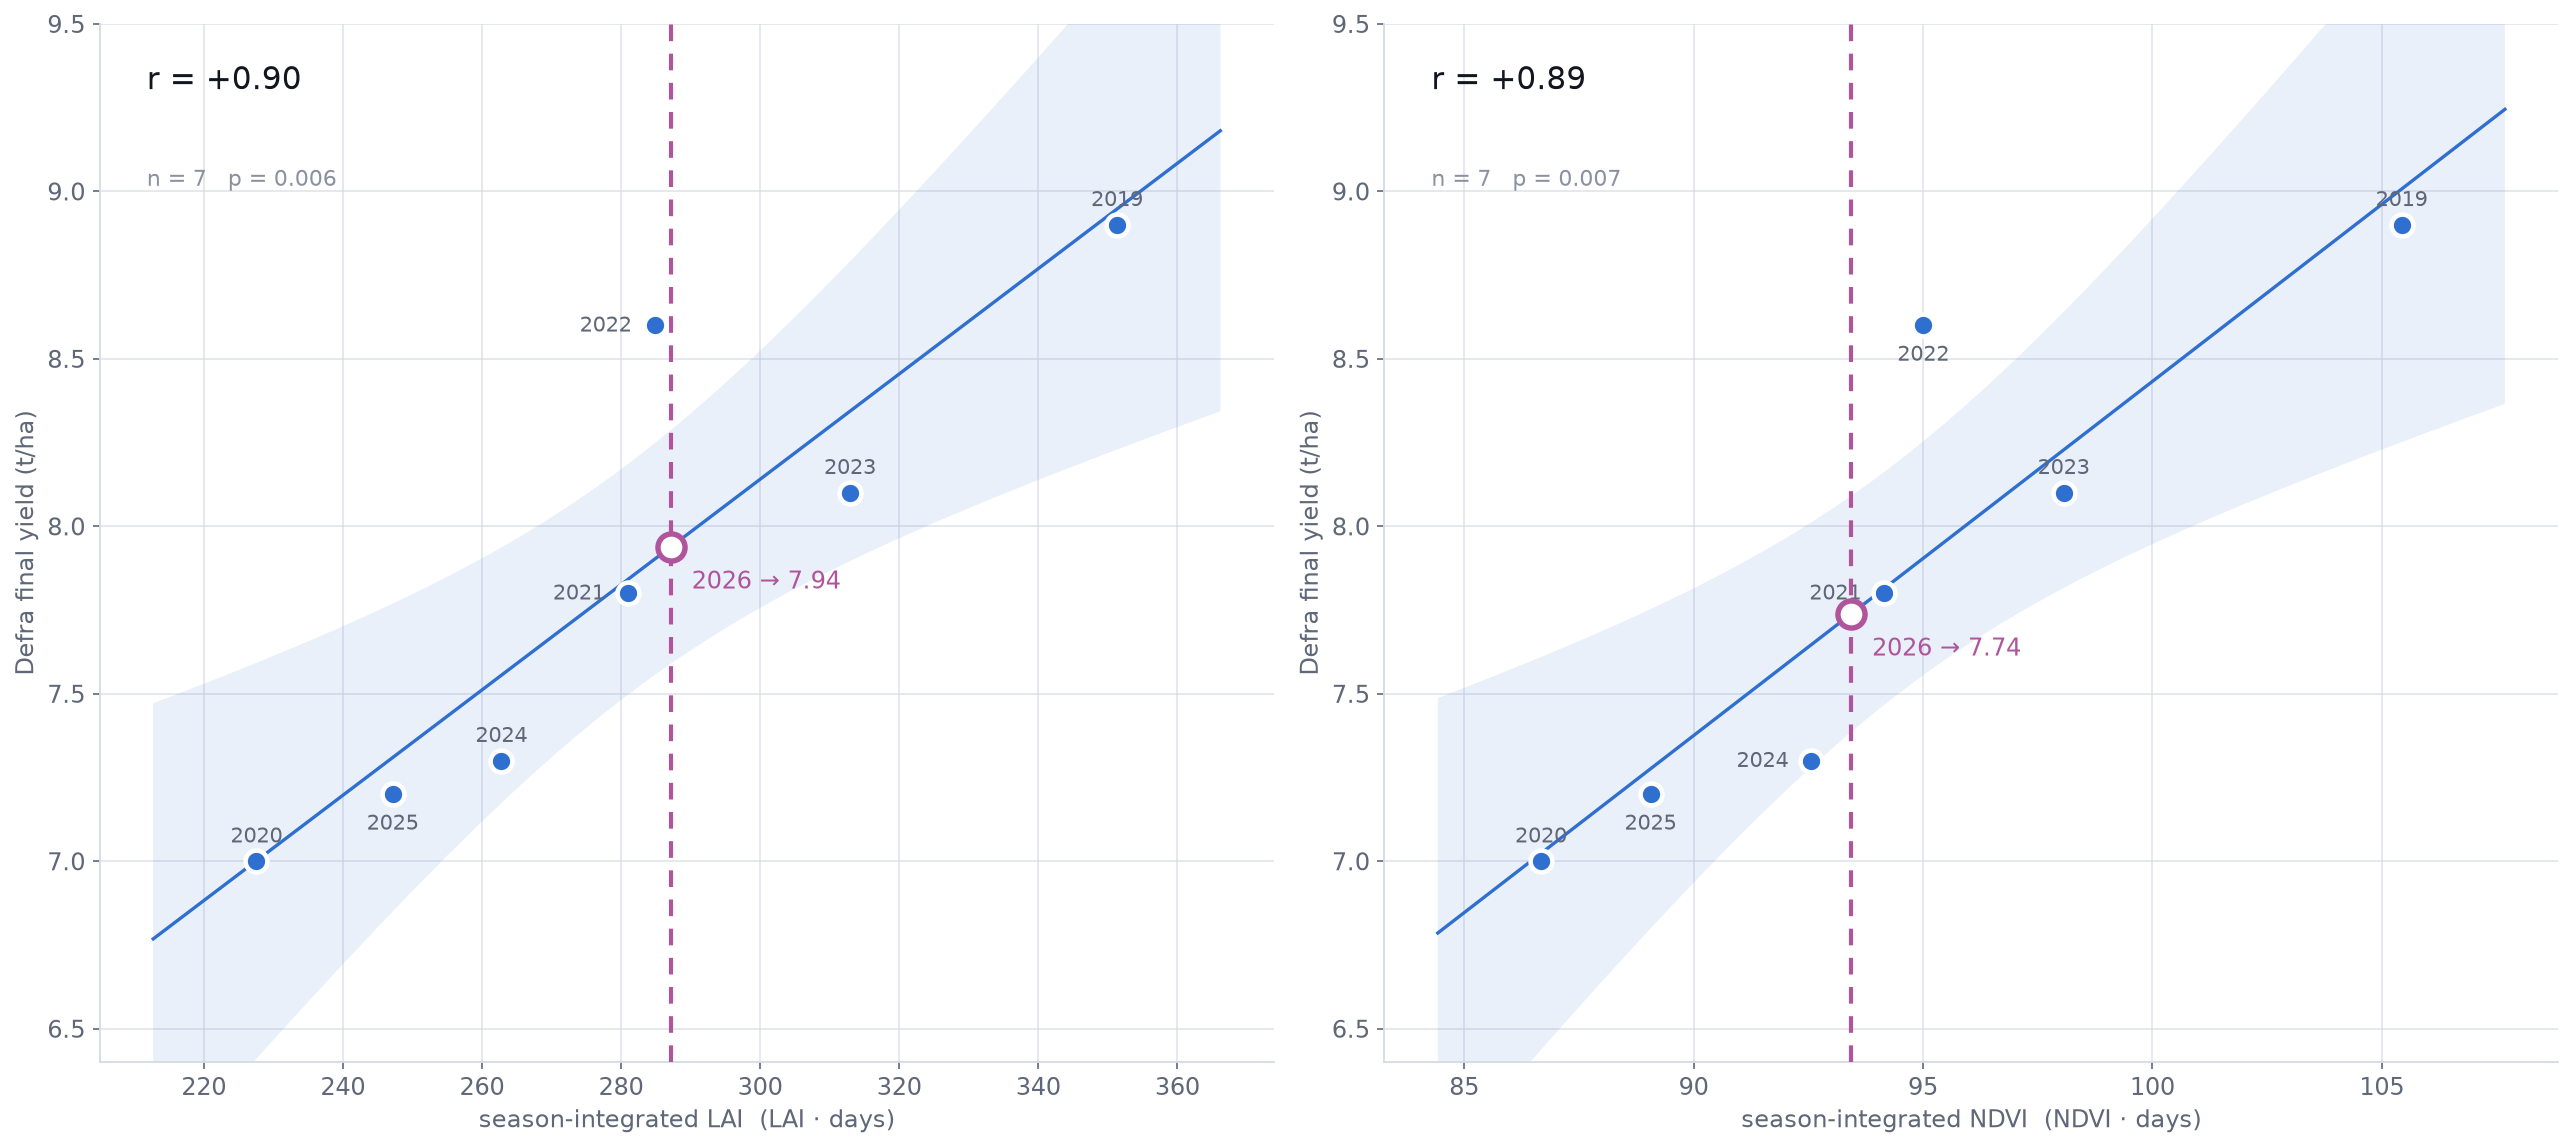
Historical association with Defra all-wheat yield: r = 0.90, n = 7 settled seasons.
Simple canopy check · NDVI
7.74 t/ha
Historical association with Defra all-wheat yield: r = 0.89, n = 7 settled seasons.
Evidence pointing the other way
32%
Late-season leaf area fell to 32% of peak—the third-fastest decline in the eight-season record. It remains an unresolved stress or early-maturity signal, not a one-way adjustment.
The simple checks
Where 2026 falls on the season-integral fits.
Historical association
Season-integrated canopy against Defra final all-wheat yield, 2019–2025, with 2026 read off each fit. These checks share imagery, masks and processing with the main system, so they corroborate rather than independently validate. Tap the chart to open it full size.
Why the canopy checks matterHistorical association
A simpler route lands in the same range.
Season-integrated LAI and NDVI use fewer modelling assumptions than the main yield system. They do share Sentinel-2 observations, crop masks and processing, so they are corroborative rather than fully independent validations.
What happened after 1 August?Timing risk
The yield estimate cannot see later physical losses.
England’s July 2026 rainfall was only 6.5 mm—10% of normal—so the wet-harvest mechanism seen in 2023 was less likely. Post-cutoff loss is still possible; it stays a disclosed risk here, and no adjustment is applied for it — none was pre-specified and validated out of sample.
03 / METHOD
From observation to supply
One traceable chain, with observed and inferred quantities kept separate.
Satellite reflectance is observed. Crop classification, leaf area, yield and uncertainty are derived or modelled. Showing those steps makes the result easier to interrogate and harder to overstate.
01 · OBSERVED
Satellite reflectance
Dated Sentinel-2 surface reflectance, cloud masks and quality flags.
02 · DERIVED
Crop state
Winter-wheat class, LAI, NDVI and seasonal timing for each field.
03 · MODELLED
Field outcome
Yield estimate and uncertainty for each field classified as winter wheat.
04 · AGGREGATED
Region and GB
Area-weighted field estimates rolled up without losing the underlying distribution.
05 · CALCULATED
Production
Mapped field area multiplied by estimated field yield.
06 · TESTED
External evidence
Weather, farm returns, condition reports, trials, quality and later official statistics.
Historical temporal behaviourn = 7
r = .93
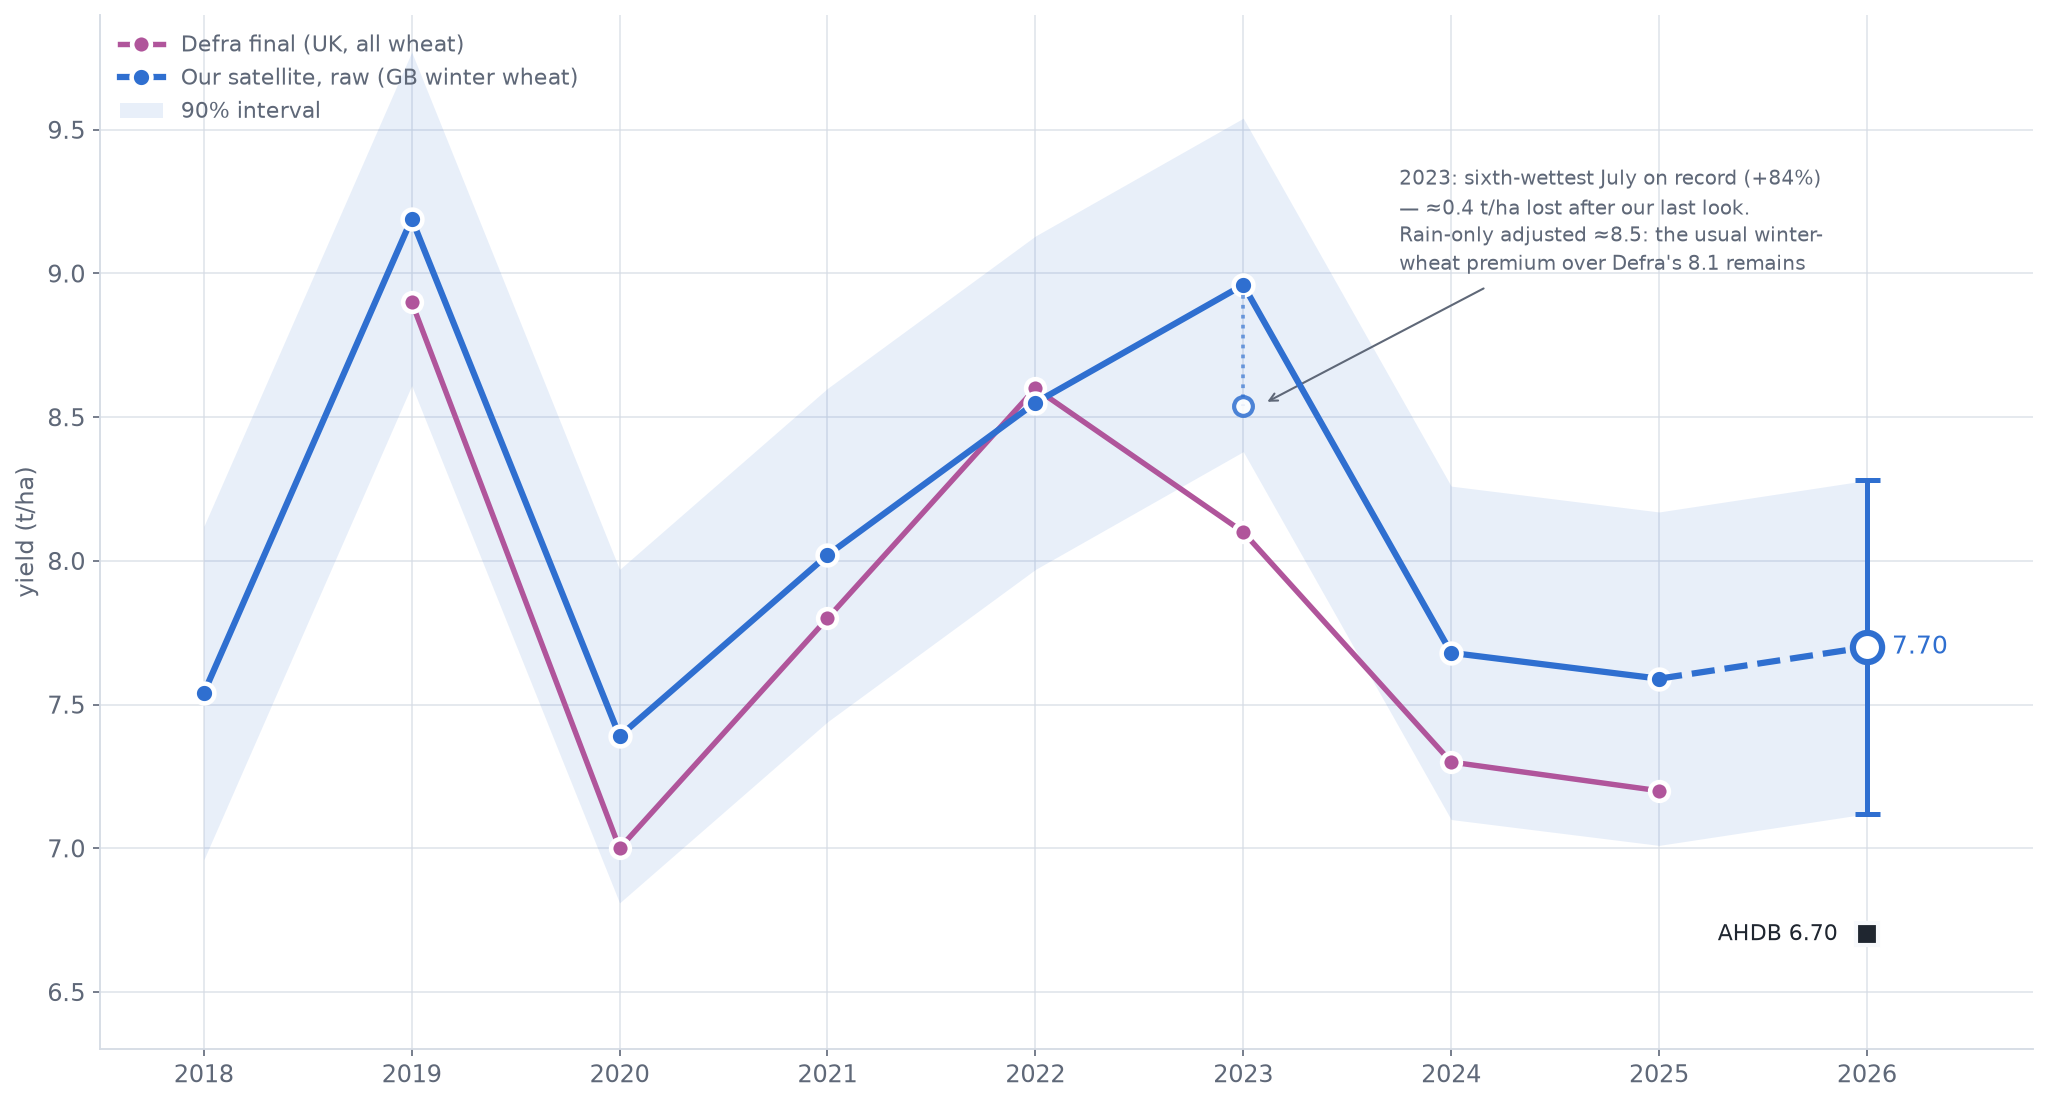
Our raw winter-wheat series follows the year-to-year movement in Defra’s final all-wheat series across 2019–2025.
0.90regression slope
+0.35mean level difference, t/ha
7settled seasons
The targets differ: Great Britain winter wheat versus United Kingdom all wheat. This supports year-to-year behaviour; it is not a complete accuracy assessment.
The eight-season record
The raw series against Defra finals.
n = 7 settled seasons
The raw GB winter-wheat series (band: 90% interval) against Defra final UK all-wheat. The level gap of about +0.35 t/ha is expected from the differing targets; the co-movement is what validates. In 2023 heavy July rain cut what reached the barn — adjusting that year for rain alone brings it to ≈8.5, keeping the usual premium over the 8.1 final. Tap the chart to open it full size.
04 / EVIDENCE
A set of instruments—not a scoreboard
Public evidence becomes clearer when its target stays attached.
The most important redesign is to replace the single ranked number line. The matrix below lets agreement and disagreement remain useful without implying that every source estimates the same crop, geography, date or statistical quantity.
Source
Question answered best
Current evidence
Important limit
Our field record
Model estimate
Where is the GB winter-wheat crop strong or weak, and how did it develop?
200,161 classified fields; yield from imagery to 1 August, mapping to 17 August; outputs from field to national level.
7.70 t/ha
1.558 Mha · 12.00 Mt · 90% intervals published
Not a combine measurement for each field.
Needs an explicit bridge before comparison with UK all-wheat finals.
AHDB harvest survey
Reported returns
What are participating farms reporting from wheat harvested so far?
Survey yields are nationalised using AHDB’s published method.
6.7 t/ha
85% harvested · range 3.9–11.5 · data to 10 August
A sample, not the mapped population.
60 farms and about 38,500 ha across all surveyed crops; no published sampling interval.
AHDB crop development
Condition measure
How did assessed winter-wheat condition change before harvest?
Area shares classified from very poor to excellent.
58%
good or excellent on 22 June; down from 75% at end-April
Not a numerical yield forecast.
It is evidence of changing crop condition, not tonnes per hectare.
Recommended Lists
Trial result
How did varieties perform at managed trial sites?
Control means and variety performance relative to multi-year trial benchmarks.
9.75 t/ha
18 treated sites in the 18 August file used by the current evidence page
Not commercial national yield.
AHDB explicitly cautions against direct comparison; the reporting site set evolves.
Merchant quality panel
Commercial samples
What quality is appearing in submitted milling samples?
Specific weight, protein and Hagberg provide context on sampled grain quality.
≈82 kg/hl
Group 1 specific weight · protein around 13.5% in the report
Cannot identify national yield components.
Specific weight also depends on variety, density, grain size and packing; the panel is not a national yield sample.
USDA WASDE
Balance sheet
What UK all-wheat production fits the global supply-and-demand balance?
A monthly production estimate used in an international commodity framework.
12.00 Mt
August · revised from 13.50 Mt in July
Production is not a unique yield.
Any yield comparison also requires a common area assumption.
Defra final
Official statistic
What is the final official UK all-wheat area, yield and production estimate?
The benchmark against which the frozen 2026 call can later be evaluated.
Not yet available
2026 final due later · our frozen call for it: 7.18, 90%: 7.01–7.36 (fitted route 7.75, 90%: 7.17–8.33) — derivation in 05
Not field-level or weekly.
Its strength is the final national statistical estimate, not within-season spatial monitoring.
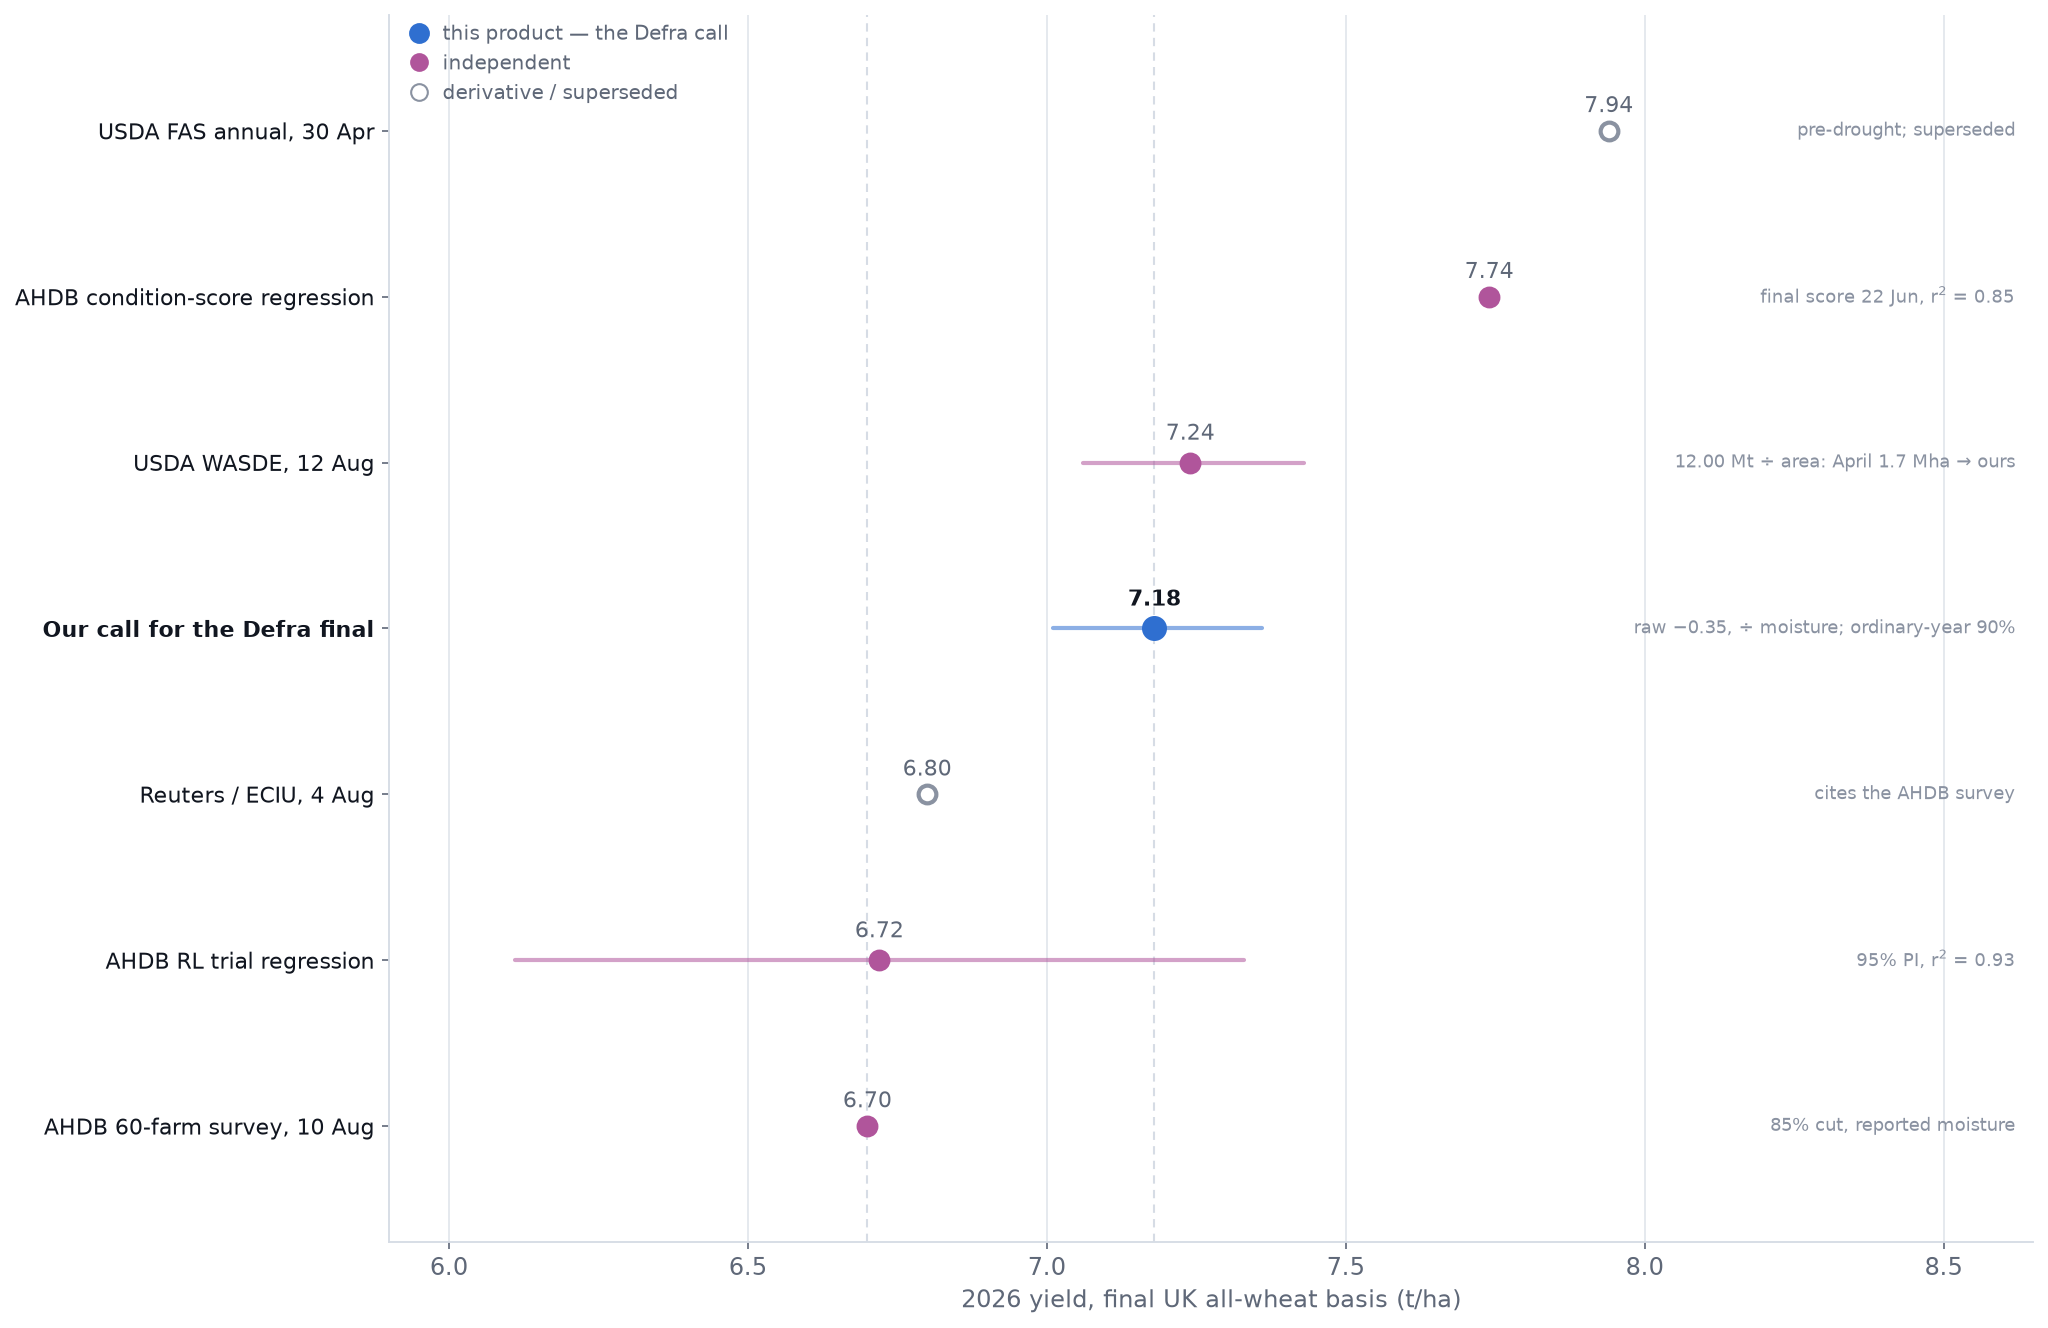
The instruments on one axis
A convenience view — read it with the matrix above.
Convenience view
A single-axis summary of the matrix. It is a convenience, not a scoreboard: the sources answer different questions, and the intervals mean different things. Our single entry is the Defra call (ordinary-year 90%, backtested above) — the raw 7.70 winter-wheat headline is not on this axis, and the fitted-route alternative (7.75) lives in the audit record, not on the chart. Tap the chart to open it full size.
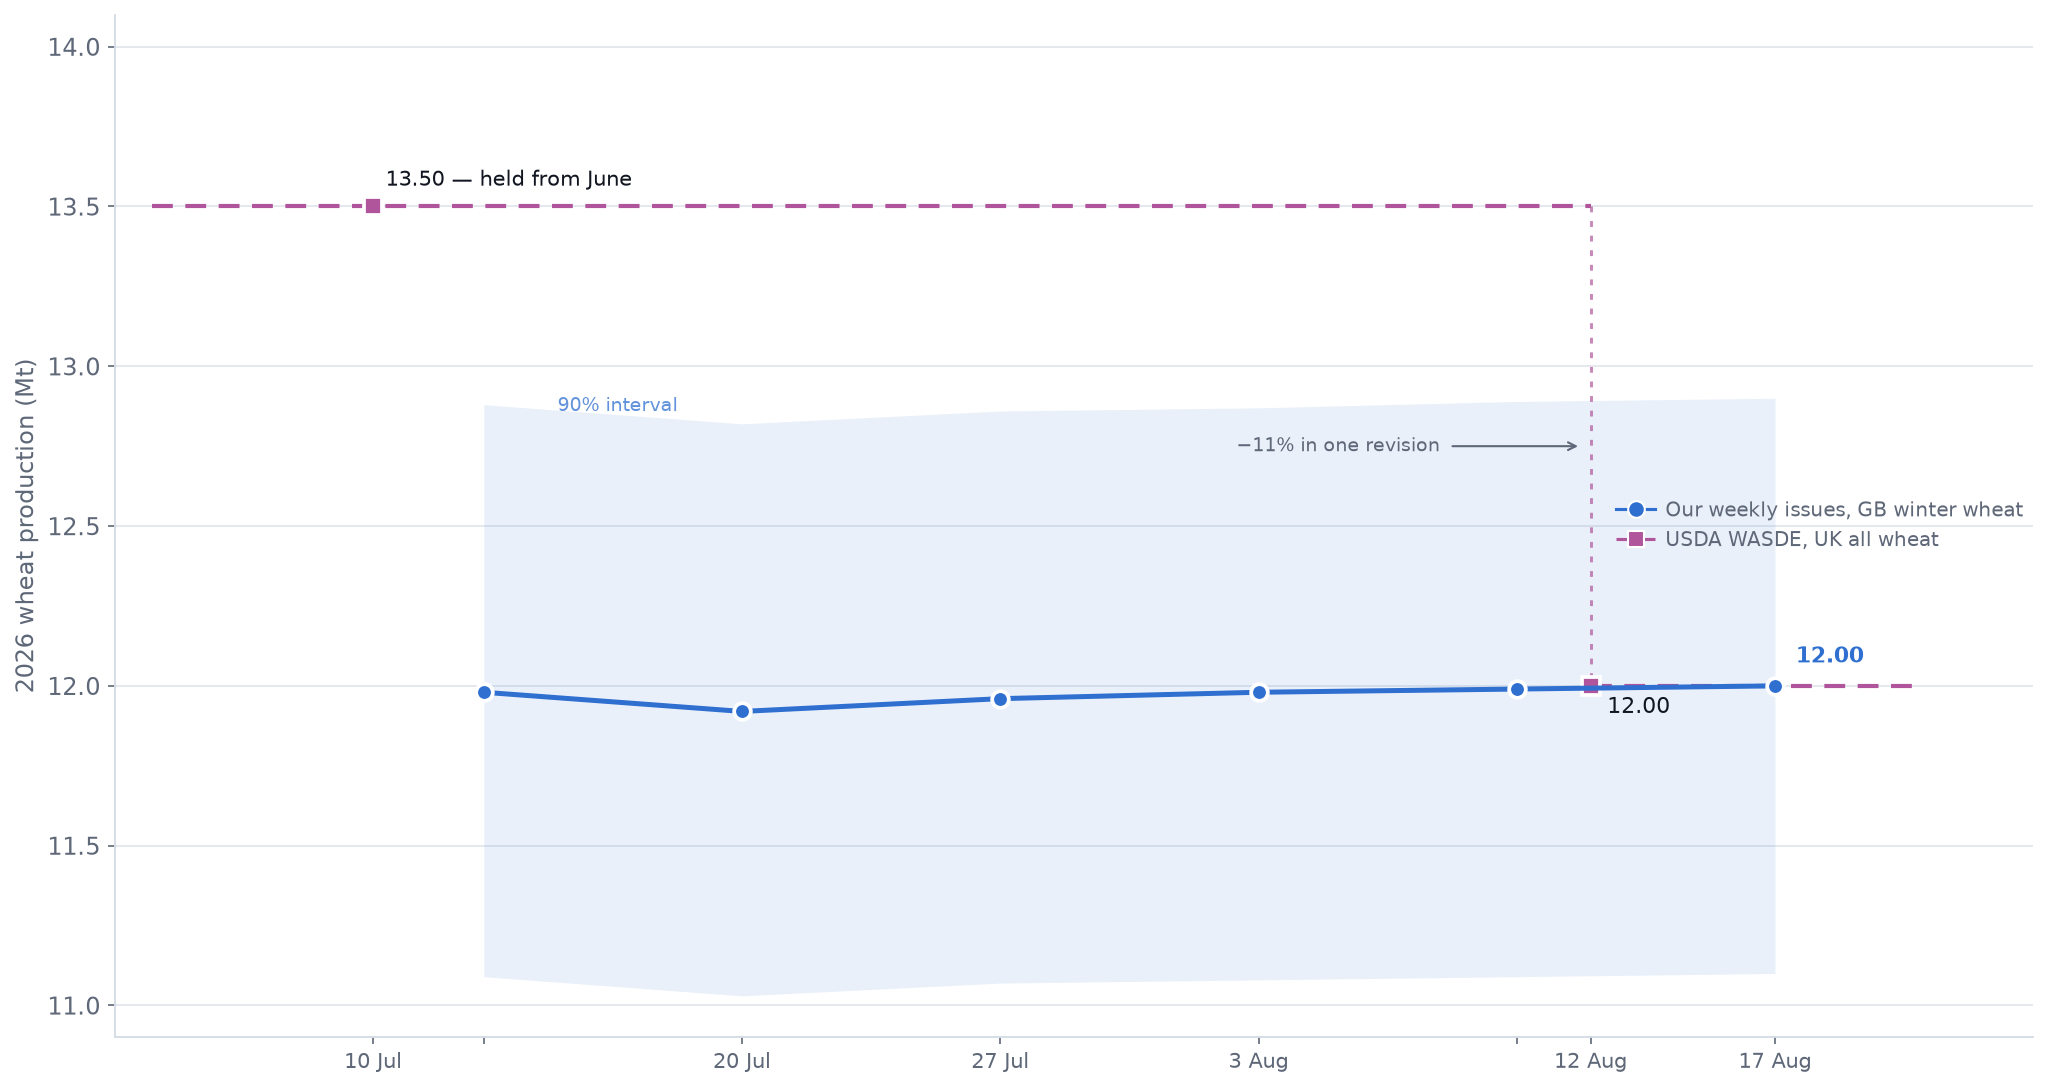
Production
Two revisions moved toward the field record.
Balance-sheet comparison
Our GB winter-wheat production (band: 90% interval) against USDA’s UK all-wheat balance-sheet figure, revised from 13.50 Mt in July to 12.00 Mt in August. The scopes differ — UK all wheat adds spring wheat and Northern Ireland — so convergence, not equality, is the observation. Tap the chart to open it full size.
Where the evidence aligns
Dry, early and highly variable.
Condition deteriorated through spring; harvested farm results span a very wide range; trial yields sit below their recent benchmark; the map concentrates losses in drier southern and eastern areas; and sampled milling grain often retained strong quality.
Where it still differs
The national yield level remains unresolved.
Our record estimates 7.70 t/ha for Great Britain winter wheat. AHDB’s early harvest estimate is 6.7 t/ha for wheat reported so far. The gap is material; its meaning depends on scope, sample, timing and moisture convention.
05 / TRANSLATION
One measurement, three public yardsticks
One field record, three public numbers.
The same measurement meets three unlike yardsticks: a farm survey read mid-harvest (6.7), the official all-wheat final still to come (our call: 7.18), and a global balance sheet (12.00 Mt). Each comparison is information — provided its basis travels with it.
Our field record · issued 17 August
7.70
t/ha
Great Britain winter wheat
Field-population model · yield from imagery to 1 August · 90% interval 7.13–8.28.
AHDB adjusts survey yields above 14.5% moisture down but does not uplift yields below 14.5%. Defra has used the same asymmetric convention since 2022. Our historical target spans that convention change unless it has been independently normalised to a fixed moisture or dry-matter basis.
A common-basis reconstruction is needed before attributing a precise share of the 1.0 t/ha difference to moisture.
The official yardstick · our call
7.18
t/ha · where we expect Defra’s final UK all-wheat yield to land · 90%: 7.01–7.36
7.70 — our winter-wheat headline, standardised moisture — the raster-faithful number the live map shows
− 0.35 — the winter-wheat premium in the eight-season series (03); scatter ±0.08
÷ 1.018–1.029 — the moisture arithmetic above; Defra does not uplift dry grain
= 7.18 ± 0.18 — 90%, from the route’s own backtest; July losses ≈ 0 in the driest July on record
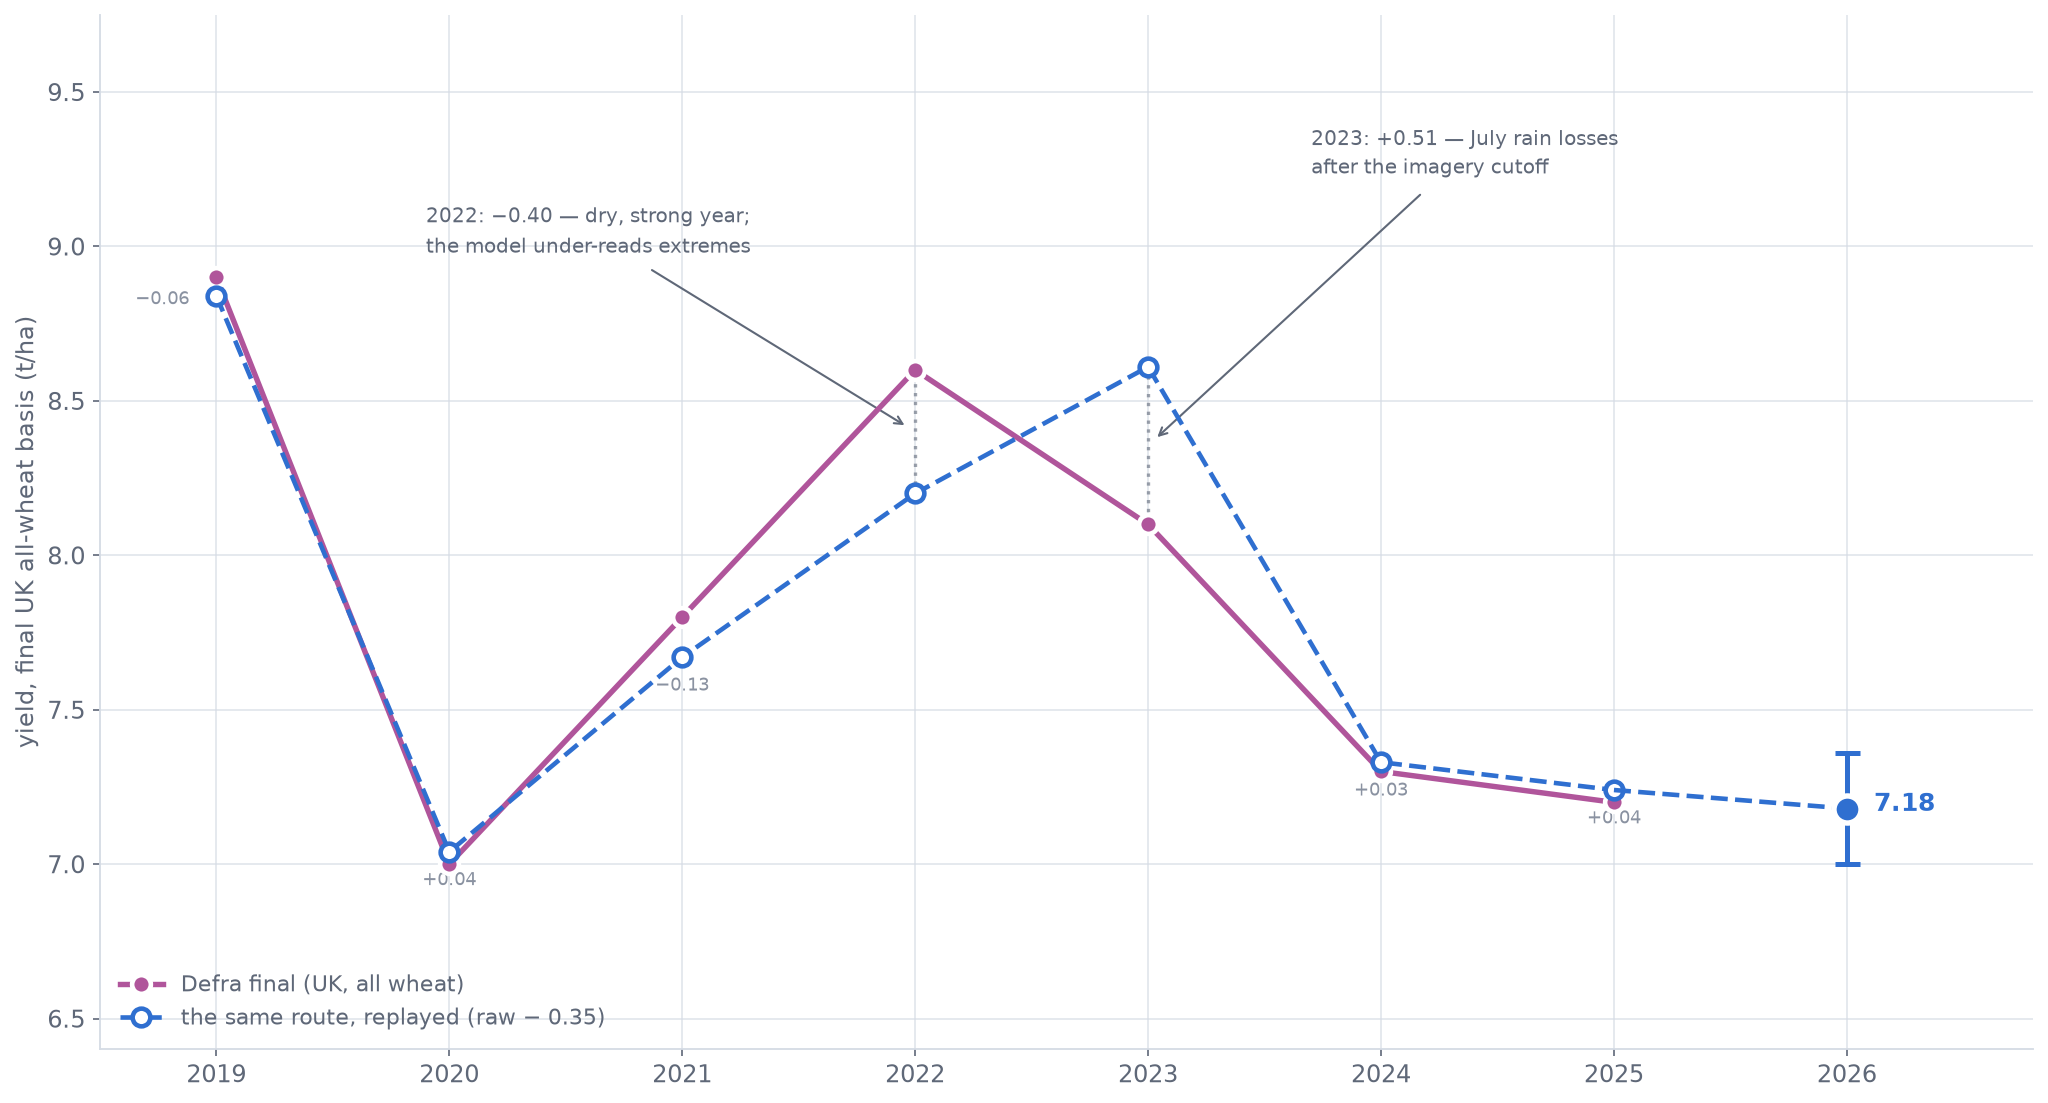
The interval is empirical, not assumed: replayed over the settled seasons (below), the same route lands within 0.13 t/ha of Defra in every ordinary year (MAE 0.06). It is an ordinary-year interval — the two abnormal years missed by −0.40 and +0.51, the tail risk it does not cover. The purely fitted route — raw plus a fitted rain term, regressed on Defra finals — reads 7.75 (90%: 7.17–8.33); its dry-year term rests on 2022 alone, a year the model under-read. Both routes are frozen in the audit record (06).
Against Defra’s own historyFrozen 20 Aug
our call 7.18 ± 0.18
survey 6.70
2020 7.0
2025 7.2
2024 7.3
2021 7.8
2023 8.1
2022 8.6
2019 8.9
Level with the weak years — not a recovery. 7.18 (90%: 7.01–7.36) lands beside 2025 (7.2) and 2024 (7.3): a third consecutive weak Defra year, ahead of only 2020 at the central value and well below the seven-year average of 7.84 — yet still above the farm survey’s 6.70. On Defra’s all-wheat area (≈1.66 Mha) it implies ≈11.92 Mt of production (11.64–12.22), bracketing the 12.00 USDA moved to in August.
The caveat we publish ourselves: the record attenuates extreme years (out-of-fold slope 0.42). If 2026 truly is survey-weak, Defra can land below 7.0 — our reading cannot rule that out. Either way this call is frozen, and will be scored.
The bridge, backtested
The same route, replayed over every settled season.
n = 7 seasons
The route behind the call, applied year by year. Ordinary years land within 0.13 t/ha of the final; the two abnormal years miss in the two known ways — 2022 (dry, strong; under-read) and 2023 (post-cutoff rain losses) — which is why the 2026 interval is labelled ordinary-year. Tap the chart to open it full size.
What might move the comparison next?
Later northern harvest returns could change the farm-survey estimate; the final wheat area could move the production comparison; and official regional results will test whether the north–south ranking appears in a different measurement system.
Why are crop-condition and trial regressions not shown as national forecasts here?
They answer different questions and are based on only seven or eight historical seasons. The trial network also changes as results arrive. They remain useful technical context, but converting them into co-equal national yield numbers creates more apparent precision than the evidence supports.
How is USDA production compared here?
USDA publishes production, not yield, so a yield comparison exists only under a stated area assumption. The ledger converts the 12.00 Mt August figure using our mapped 1.558 Mha and a 93–96% winter share of UK wheat area, giving an implied 7.06–7.43 t/ha; the production chart compares the tonnage directly, where the scopes differ only by spring wheat and Northern Ireland.
06 / AUDIT
A forecast should leave a record
Traceability becomes real when the original call cannot quietly change.
A reader should be able to retrieve the data cutoff, model version, scope, transformation and uncertainty method after the harvest outcome is known. The audit card below shows the minimum public record.
Forecast ID
WW26-2026-08-17
Issued
17 August 2026
Evidence compiled
19 August 2026
Yield imagery cutoff
1 August 2026 · day 213 — the model’s final cutoff; published yield unchanged since the 3 Aug issue
Mapping imagery
through the issue week · 17 August 2026 — the field set and area keep updating
The test is set now — before Defra publishes 2026.
The comparison to the official UK all-wheat result uses the bridge declared in 05 — the ~+0.35 winter-wheat premium and the delivered-moisture conversion — and both targets are also shown unbridged, never as if identical.
Mapped area, mean yield and production will each be scored separately, not blended into one number.
We will report the national error, whether the north–south regional ranking holds in the official regional results, and matched-field error where combine records exist.
The test of record: does Defra’s final land inside 7.17–8.33 t/ha — and how close to the 7.18 call (90%: 7.01–7.36)? Area (1.542–1.574 Mha) and production (11.1–12.9 Mt) are scored on their own intervals.
This issue stays frozen. The final benchmark, the error and the diagnosed causes will be published alongside it, without rewriting this record.
07 / FIELD
Make the capability understandable
One field record can demonstrate space, time, uncertainty and provenance at once.
Rather than listing product attributes, follow one real, anonymised field from the frozen issue: its boundary, its weekly estimate, its within-field variation and the caution each layer deserves.
10 m yield · 17 Aug issue · same 4–10 t/ha scale as the live map
Anonymised winter-wheat field
Parcel 30UXD-84370
5–95% band shown
A real parcel from the frozen 17 August issue — 25.7 ha in Lincolnshire, East Midlands, coloured exactly as the live map. The estimate is a model output, not a combine record; the shaded band is the model’s pixel-level 5–95% range averaged over the field.
25.7 hamapped boundary · anonymised parcel ID 30UXD-84370
7.59 t/ha17 Aug issue · moved <0.07 t/ha across six weekly issues
2,547 px10 m detail · within-field p10–p90 spans 3.5–9.5 t/ha
6 issues13 Jul – 17 Aug · frozen at the 1 Aug yield cutoff
What this record adds
Not another isolated harvest number. A crop that can be examined, replayed and tested.
The value becomes visible in the evidence itself: where the national total came from; how it changed through the season; why public sources do or do not line up; what remains uncertain; and whether the frozen call survives the final result. Two numbers leave this page: 7.70 t/ha for the winter wheat we measure, and 7.18 (90%: 7.01–7.36) for the all-wheat figure we expect Defra to publish.